BY MARK BLESSINGTON – The US has high income inequality compared to other large economies. While income inequality in the US is close to China, it is rising in the US while declining in China. Many studies use the Gini statistic to measure income inequality. A Gini of 100% represents maximum income disparity, and a Gini of 0% occurs when everyone earns the same amount. Chart 1 shows the most recently available Gini statistic for the world’s largest economies.

Articles in every major business publication regularly express concern about prolonged high levels of income disparity. Both Republicans and Democrats in the US position themselves as champions for reducing income disparity. But solutions have been exceedingly elusive. Part of the reason is that we consistently seek solutions without fully understanding the problem.
Conventional wisdom says tax policy, and specifically progressive taxation, is the critical tool for managing income disparity. The theory is that heavier taxes on the rich will reduce income disparity. But history is not kind to this theory. In fact, progressive taxation has been a weak tool for managing income disparity.
Chart 2 shows how various effective tax rates for top income earners do not have a consistent impact on Gini.

The effective tax rate for top income levels dropped for the wealthy few during the second half of the Clinton administration, and the descent continued through most of the Bush administration. Then the rate increased during the Obama administration.
If conventional wisdom was correct, the rate cuts for the wealthy few by the Clinton and Bush administrations from 1996 to 2007 would have driven Gini up substantially, but instead it only increased slightly. Then, the higher tax rates for top earners in 2013 and 2014 should have forced Gini down, but instead Gini jumped above 70%.
Clearly, there has been a weak relationship between tax policy and Gini for the last several decades.
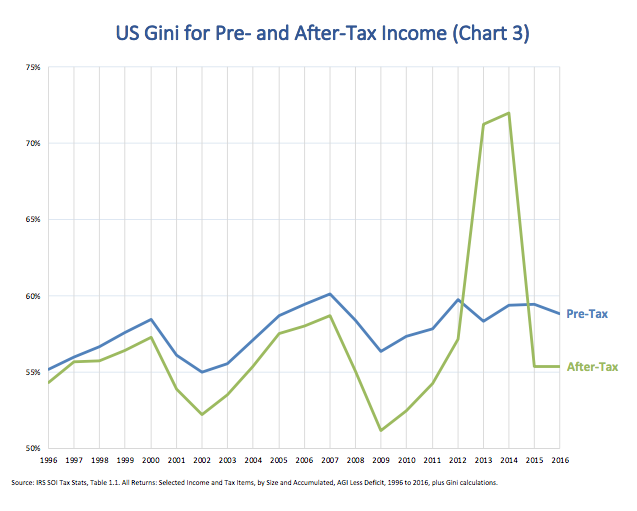
The small impact of tax policy is pictured in Chart 3. Pre-tax Gini tends to be a bit higher than after-tax Gini. From 1996 to 2016, the average drop from pre- to after-tax Gini is almost one percentage point. When excluding the aberrant years 2012 and 2013, the average drop in Gini is 2.3 percentage points. So, US tax policy typically has a relatively small impact on income inequality.
So, what really drives Gini in the US? The answer starts to reveal itself by looking at business cycles. During the Dotcom bubble, Gini rose quickly. Then it dropped just as quickly during the Dotcom crash. Then Gini went on the rise again during the housing bubble, crashed during the Great Recession, and rose again during the jobless recovery.
Clearly, US income inequality is very sensitive to business cycles. When the economy is strong or recovering, incomes for the wealthy few grow more rapidly than for everyone else. Conversely, when times are tough, the wealthy few lose more. This pattern holds regardless of political administration or their tax policies.

At this point it is important to use more precise language. The business cycles depicted in the chart above are actually indications of stock market trends. While the terms “economy” and “stock market” are often used interchangeably, the stock market is largely irrelevant to most of the US population. This observation leads us to discover the true driver of income disparity in the US.
In 2016, salary and wages were 70% of total income on the average US tax return (see Chart 5). The next largest contributors were pensions, partnerships and S-Corporations, capital asset sales, Social Security, dividends, and business net income.
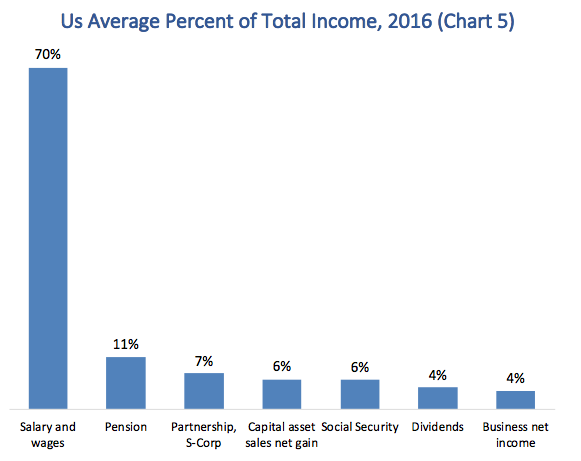
Which of the seven major income sources from Chart 5 plays the biggest role in driving Gini levels and trends?
The answer was implied in Chart 4, where Gini rose and fell depending on stock market trends. As we can see in Chart 6, the Gini for capital assets is the highest of all income sources and averages close to 80%. Further, Gini for capital assets has grown by 14 points from 1993 to 2016 (66.7% in 1993 to 80.7% in 2016).
Capital assets represent a broad array of personal assets, including the sale of residential property, stocks and bonds. But 66% of net gains from capital assets are derived from stock sales.
Even though capital assets only provided 6% of total income on average in 2016, they contributed 43% of total income for the top income group: those with AGIs of $10 million or more. Conversely, capital assets provided less than 1% of total income for tax filers with AGIs under $75,000.
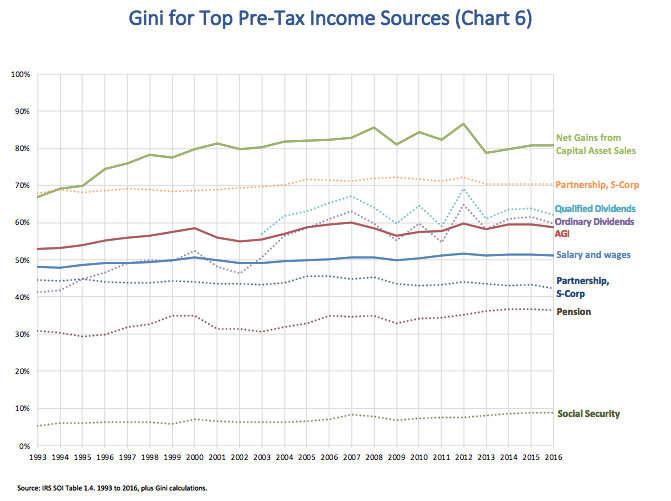
While partnerships and S-corps have a very high Gini level (averaging around 70%), this income source has remained steady over time, so, it has not contributed to the rise in Gini.
Income sources with low Gini levels are Social Security, pensions, partnerships and S-corps, and salary and wages. Since salary and wages represented 70% of average income in 2016, and its Gini only rose 3 percentage points from 1993 to 2016, we can conclude it did not contribute to Gini growth.
The second most significant contributor to Gini growth is dividends. Dividends, of course, are directly tied to stocks. As the value of stock ownership has increased among the wealthy few, dividends flowing from these assets have accentuated income disparity and have contributed to its growth.
All of these facts make the conclusion obvious: stocks are the major driver of US income inequality.
Conclusion
The annual US hubbub surrounding personal taxes misses the most significant factor driving income inequality: stock options and grants. The mechanisms that allow and encourage corporations to make outsized executive stock and option grants must be the focus of efforts to reduce income disparity in the US.
US governments, stockholders, and employees have no way to press corporations to make more equitable stock and option grants to all employees rather than a select few. Corporations frequently pay executives in ways that imply a single executive is worth hundreds and sometimes even thousands of fellow employees. Stockholders regularly complain about stock grants, yet they consistently fail to rein them in. US states set and administer laws that govern corporations, yet they have no laws that prohibit excessive stock grants.
For many decades now, tax laws make stock and option grants far more tax effective than cash bonuses for executives and corporations. The capital gains tax rate is lower than the tax on high salaries. Dividends are taxed at a lower rate than cash compensation. Corporations achieve tax benefits from stock and option grants over cash bonuses.
The excessive use of stocks and options in executive compensation has led to unprecedented levels of stock buybacks, which offset the dilutive effect of massive stock and option grants for top executives. This use of corporate profits is highly unproductive. It diverts cash from rank-and-file wage increases or bonuses and restricts investments in R&D or plant and equipment. Stock buybacks do not drive a healthy economy, they undermine it.
Progressive tax policies could do far more than merely shift Gini by one or two percentage points, especially if they focused specifically on the capital gains and dividends tax rates. Indeed, the recent tax cuts by the Trump administration will surely drive the US Gini to unprecedented levels.
Most importantly, no material shift in US income inequality will occur until stock and option awards are regulated and forced to be more equitable across all employees.